
In Canada, we count seats, not votes. Most models project seat counts based on geography, and often assume that party strength and patterns of political competition are stable. INNOVATIVE’s model, which groups seats by competition rather than region, shows when party strength and competition may be changing. In the 2022 Ontario election, they are changing.
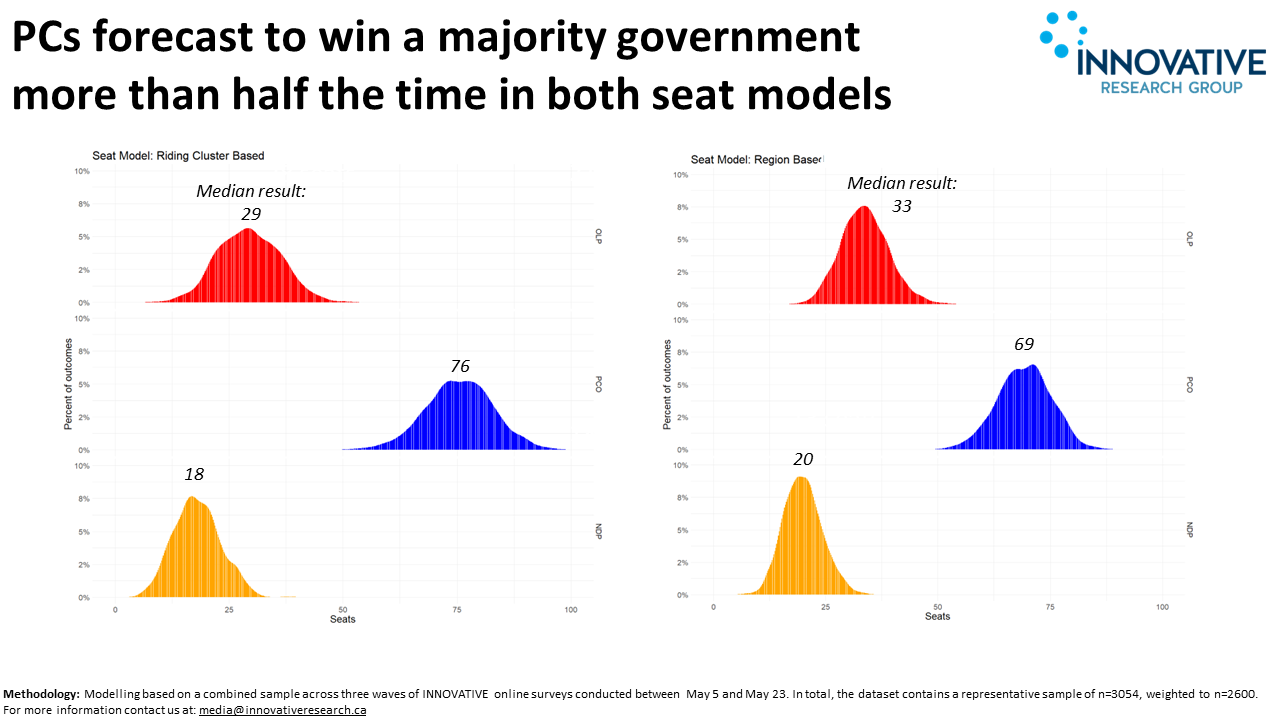
Combining this unique “riding cluster model” with recent polling, INNOVATIVE projects a Tory majority as the likeliest outcome on June 2. These findings come from new modelling based on a combined sample across three waves of INNOVATIVE online surveys conducted between May 5 and May 23. In total, the dataset contains a representative sample of n=3054, weighted to n=2600.
Simulations
The PCs are projected to win a majority government 87% of the time in a regional swing model and 98% of the time in a seat cluster model, based on 1000 simulations for each model. Both the Liberals and the NDP perform slightly better under the regional model.
The horserace has remained very stable throughout the campaign. The Tories have maintained their lead throughout, with the Liberals in second and the NDP in third.
Under the hood, however, some important shifts are underway.
Seat Clusters
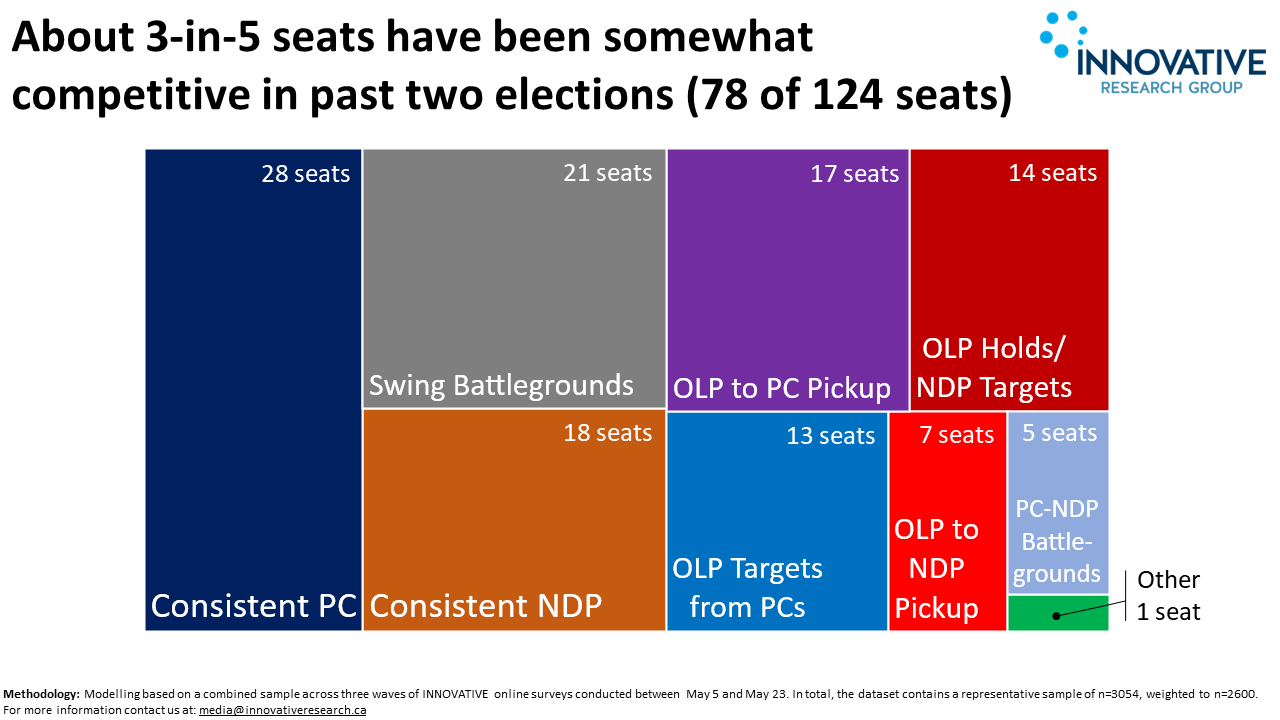
Seat cluster analysis separates Ontario’s 124 ridings into 9 distinct groups. These groups are selected based on patterns of competition and party success over the past two elections. By grouping ridings in this way, these seat clusters can help explain shifts in support for the parties.
Across Ontario, there are 124 ridings. In the past 2 elections, 28 have consistently voted PC and 18 have consistently voted NDP. The PCs compete with the Liberals in 30 ridings and the NDP in 5 ridings. In 21 ridings, the Liberals compete with the NDP. About 1-in-5 ridings are true “swing battleground” seats (21 of 124) where all 3 parties are in the race.
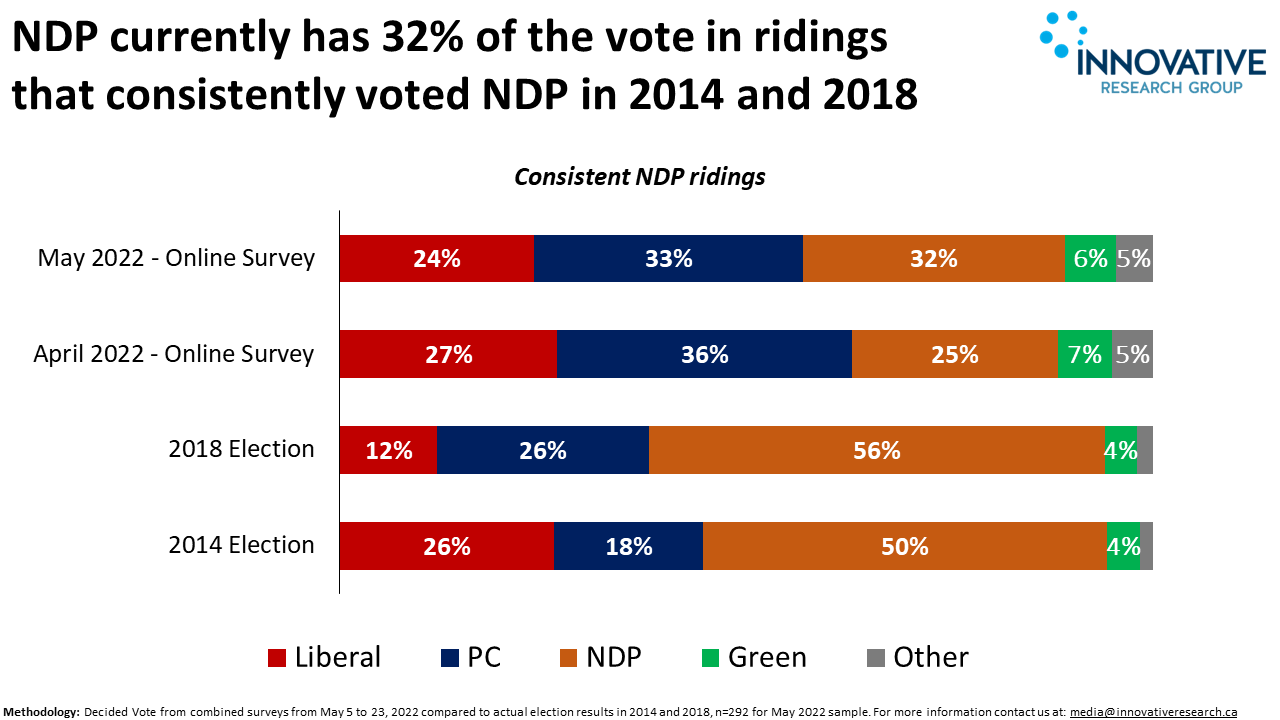
The most surprising shift is in the Consistent NDP cluster. In 2018, the NDP received 56% of the vote across these 18 seats. The latest polling shows the NDP statistically tied with the PCs in this cluster (32% to 33%, respectively). It appears likely that the NDP will lose some of their “lunch bucket” seats to the PCs.
Given the unusual decline in the Liberal vote in 2018, it is less surprising to see that the Liberals’ vote share is up in 6 clusters relative to 2018. The strongest recovery has occurred in seats the that the Liberals won in 2014 but lost to the PCs in 2018. The Liberals will be retaking some of their losses to the PCs.
Regional Clusters
Regional analysis separates Ontario’s 124 ridings into 9 geographic regions. The median outcome also shows a PC majority, but slightly better results for the Liberals and NDP relative to the cluster model.
Summary
The riding cluster model reveals when levels of political competitiveness may be changing.
This approach suggests that the likeliest outcome next week is a PC majority. The Liberals will regain some of their 2018 losses to the PCs, but the PCs will offset some of those losses with gains from the NDP.
The Liberal campaign at least gets a moral victory. The PCs will likely have an actual victory. But the NDP will likely find itself deeply wounded with some fundamental questions about who they are and what the future holds.


")


