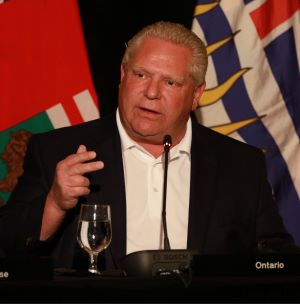
With just a few days left before Ontario heads to the polls, Doug Ford and the Progressive Conservatives maintain their lead with 42% of the decided vote. Bonnie Crombie and the Liberal Party continue to grow with 32%, tightening the gap to just 10 points (this gap was at 28 points when the election was announced).
These are some of the findings of an online survey of 800 Ontarians sponsored and conducted by Innovative Research Group (INNOVATIVE) between February 19th and 24th, 2025.
At the start of the race, Ford benefited from the “rally around the flag” effect, as voters responded to Trump’s tariff with a surge of support for the sitting government. However, this effect is slowly deflating. While lower than the start of the election, approval of the Ontario government’s response to Trump’s presidency remains positive with a net approval of +24%.
With federal Liberal leaders’ race and provincial race undergoing simultaneously, the Liberal campaign has consolidated support both from the left and the right including the following groups:
- Left Liberals and Core Left – Returning to the fold after previous disillusionment, these gains from the left are positioning the Liberals to gain seats in Toronto and, to a lesser degree, in the GTA.
- Deferential Conservatives – While Ford and the PCs continue to do well with people who identify with the PC party and those who hold Populist conservative values, they have lost ground with traditionally softer PC supporters who are now shifting towards the Liberals
- Doug Ford’s personal vote – Among the roughly one in five Ontario voters who like Doug Ford and don’t identify as PCs, the PCs have dropped from 49% to 37%, while the Liberals are up from 22% to 33%.
Meanwhile, the NDP has not been able to attract the attention of more than 20% of Ontario’s voters and has lost 15% of NDP identifiers to the Liberal party.
While only 35% of respondents have read, seen or heard anything about the recent election debates, all the leaders received similar scores on whether they met expectations. Party supporters generally felt their party’s leader did best, although PC voters were more likely to choose their own leader than other parties.
Click here to read the full report!


")


